


Putting Today’s Rates in Perspective: A Lookback on 50-Years of Interest Rates
“Interest rates are insane these days!”
“Why are interest rates so high?!”
“Interest rates are higher than ever!”
For those of us in the real estate and mortgage industry, we hear it every day! And trust me… we are a little stressed about it, too 😅 But when we take a historical look at interest rates… it’s quite interesting to see how today’s rates compare. Let’s take a journey through the past five decades to explore how mortgage rates have evolved and the economic events that influenced them.
The 1970s: Economic Turbulence and Rising Rates
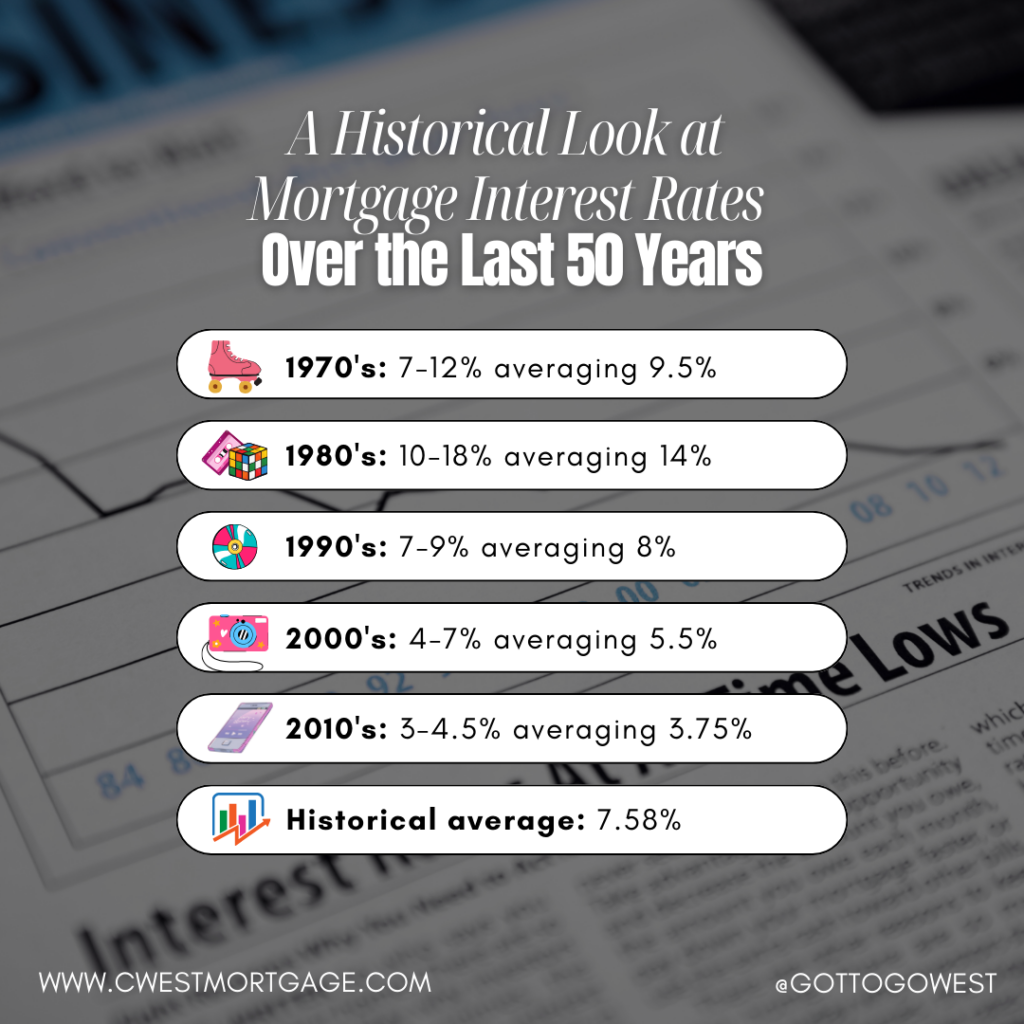
Interest Rates: 7-12%
Historical Average: 9.5%
The 1970s were marked by significant economic challenges, including the oil embargo of 1973, which led to soaring energy prices and rampant inflation. The Federal Reserve’s attempts to curb inflation resulted in higher interest rates. By the end of the decade, mortgage rates had climbed to around 12%, making home loans significantly more expensive.
The 1980s: Battling Inflation with High Rates
Interest Rates: 10-18%
Historical Average: 14%
The early 1980s were characterized by extremely high mortgage rates, peaking at over 18% in 1981. This was a direct response to the Federal Reserve’s aggressive monetary policy under Chairman Paul Volcker, aimed at combating the high inflation of the late 1970s. As inflation was brought under control, rates gradually decreased, but they remained high by today’s standards throughout the decade.
The 1990s: Economic Recovery and Stabilization
Interest Rates: 7-9%
Historical Average: 8%
The 1990s saw a period of economic growth and relative stability. After the recession of the early 1990s, the Federal Reserve cut rates to stimulate the economy, bringing mortgage rates down to more manageable levels. By the mid-1990s, rates hovered around 7-9%, making homeownership more accessible to a larger segment of the population.
The 2000s: Boom, Bust, and Recovery
Interest Rates: 4-7%
Historical Average: 5.5%
The early 2000s experienced relatively low mortgage rates, driven by the Federal Reserve’s efforts to support economic recovery following the dot-com bubble burst. However, the housing market boom of the mid-2000s, fueled by easy credit and subprime lending, led to the financial crisis of 2007-2008. In response, the Federal Reserve slashed interest rates to historic lows, dropping mortgage rates to around 4-5%.
The 2010s: Post-Crisis Era of Low Rates
Interest Rates: 3-4.5%
Historical Average: 3.75%
The aftermath of the financial crisis brought about a period of sustained low mortgage rates as the Federal Reserve kept rates low to support economic recovery. This decade saw rates as low as 3%, making it one of the most favorable periods for homebuyers and those looking to refinance.
The 2020s: Pandemic and Market Volatility
Interest Rates: 2.5-7%
Historical Average: 4.75%
Regardless of your personal feelings about the COVID-19 pandemic, something we can all agree upon is that it definitely affected the market and global economies! In 2020, the Federal Reserve responded by cutting interest rates to near zero, which pushed mortgage rates to historic lows below 3%. However, as the economy recovered and inflation concerns emerged, rates began to rise again, peaking at around 7% by late 2022 and early 2023. As of mid-2024, rates have shown signs of stabilizing, with predictions of potential decreases due to recent Federal Reserve decisions.
Overall Average Interest Rate Over 50 Years
You know, when I step back and look at the mortgage rate averages over the past 50 years, one number really stands out: 7.58%. Yep, if you take all the highs and lows we’ve seen across those five decades and smoosh them together, that’s the overall average interest rate homebuyers and owners have been dealing with.
Now I’ll be the first to admit, without having any context, 7.58% sounds pretty high! But when you zoom in on those individual decades, the rate swings are crazy! We’re talking 18% at the peak in the 80s, then down to the 3-4% range just 20 years later. No wonder homebuyers’ heads were and continue to spin!
Seeing that 7.58% average really puts things into perspective, though. It highlights just how volatile the mortgage market can be, but also shows there are stretches of relative calm and affordability baked in there too. So when rates seem to be going haywire lately, I always pull back and think – where do we sit compared to that 50-year baseline?
Sometimes the numbers make me want to pull my hair out. But having that 7.58% anchor reminds me that’s par for the course over the long haul. My job is to help buyers understand the current climate and what a “good” rate looks like without getting derailed by the frenzied peaks and valleys. With some historical context, you can make smart moves!
So don’t go it alone or get tripped up by all the rate swings. I’m just a phone call or email away, ready to be your guide through this crazy mortgage world. Whenever you’ve got questions or just need to talk through scenarios, I’m all ears. Finding you the right mortgage solution and protecting your financial future? That’s what gets me out of bed every morning!
Sources:
- Freddie Mac Primary Mortgage Market Survey (PMMS) – Historical Rates: Freddie Mac
- Federal Reserve Economic Data (FRED): FRED
- Mortgage News and Analysis: Mortgage Reports
- Industry Analysis: McKinsey
 This is not an offer to enter into an agreement. Not all customers will qualify. Information, rates and programs are subject to change without notice. All products are subject to credit and property approval. Other restrictions and limitations may apply. Copyright © 2023 | NEXA Mortgage LLC.